Perspective › Examples
Webcam — Video Wall
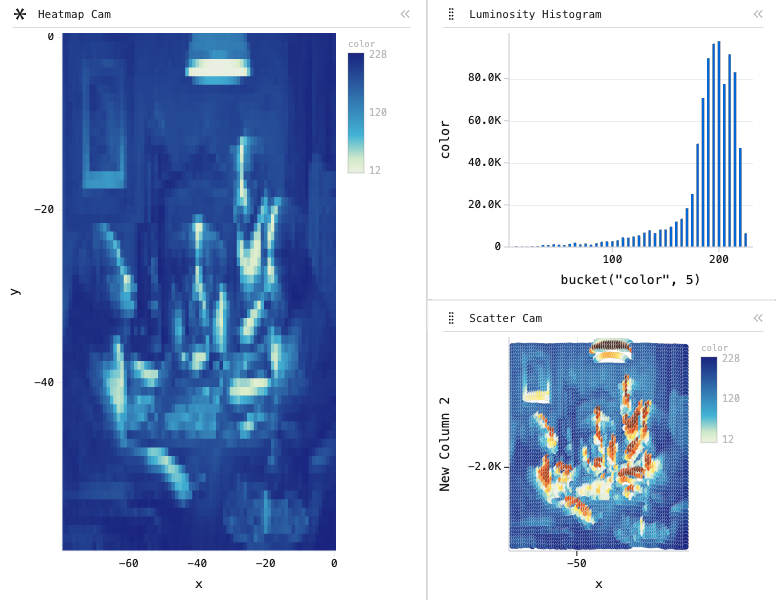
3-panel dashboard of Heatmap, Y Bar and X/Y Scatter: Heatmap chart of color, grouped by x, split by y, with 2 computed expression columns; Y Bar chart of color, grouped by bucket("color", 5), with 3 computed expression columns; X/Y Scatter chart of x, New Column 2 and color, grouped by x and y, filtered to x < 0, with 3 computed expression columns.
One camera, three readings: heatmap, luminosity histogram and scatter.
Data
Live webcam frames streamed into a Perspective table one pixel per row, and rendered back as real-time heatmaps, scatter plots and histograms.
Generated continuously in the browser by a JavaScript simulation streaming into a Perspective Table.
Configuration
This example is a saved <perspective-viewer> workspace. Pass this JSON to viewer.restoreWorkspace() to reproduce it over the same table:
{
    "layout": {
        "type": "split-layout",
        "orientation": "horizontal",
        "sizes": [
            0.55,
            0.45
        ],
        "children": [
            {
                "type": "tab-layout",
                "tabs": [
                    "heat"
                ],
                "selected": 0
            },
            {
                "type": "split-layout",
                "orientation": "vertical",
                "sizes": [
                    0.5,
                    0.5
                ],
                "children": [
                    {
                        "type": "tab-layout",
                        "tabs": [
                            "histo"
                        ],
                        "selected": 0
                    },
                    {
                        "type": "tab-layout",
                        "tabs": [
                            "scatter"
                        ],
                        "selected": 0
                    }
                ]
            }
        ]
    },
    "panels": {
        "heat": {
            "table": "",
            "plugin": "Heatmap",
            "title": "Heatmap Cam",
            "group_by": [
                "x"
            ],
            "split_by": [
                "y"
            ],
            "columns": [
                "color"
            ],
            "expressions": {
                "y": "-floor(\"index\" / 80)",
                "x": "-\"index\" % 80"
            },
            "aggregates": {
                "New Column 1": "any"
            }
        },
        "histo": {
            "table": "",
            "plugin": "Y Bar",
            "plugin_config": {},
            "title": "Luminosity Histogram",
            "group_by": [
                "bucket(\"color\", 5)"
            ],
            "split_by": [],
            "columns": [
                "color"
            ],
            "filter": [],
            "sort": [],
            "expressions": {
                "bucket(\"color\", 5)": "bucket(\"color\", 5)",
                "y": "-floor(\"index\" / 80)",
                "x": "-\"index\" % 80"
            },
            "aggregates": {}
        },
        "scatter": {
            "table": "",
            "plugin": "X/Y Scatter",
            "plugin_config": {},
            "title": "Scatter Cam",
            "group_by": [
                "x",
                "y"
            ],
            "split_by": [],
            "columns": [
                "x",
                "New Column 2",
                "color",
                null,
                null,
                null,
                null
            ],
            "filter": [
                [
                    "x",
                    "<",
                    0
                ]
            ],
            "sort": [],
            "expressions": {
                "New Column 2": "-floor(\"index\" / 80) * 50 - \"color\"",
                "x": "-\"index\" % 80",
                "y": "floor(\"index\" / 80)"
            },
            "aggregates": {
                "x": "avg",
                "New Column 2": "avg"
            }
        }
    },
    "active": "heat"
}
About Perspective
Perspective is an open-source, WebAssembly-powered data grid, pivot table and charting component for large, real-time and streaming datasets — in the browser, Python, Jupyter, Node.js and Rust.
Documentation