Perspective › Examples
Raycasting
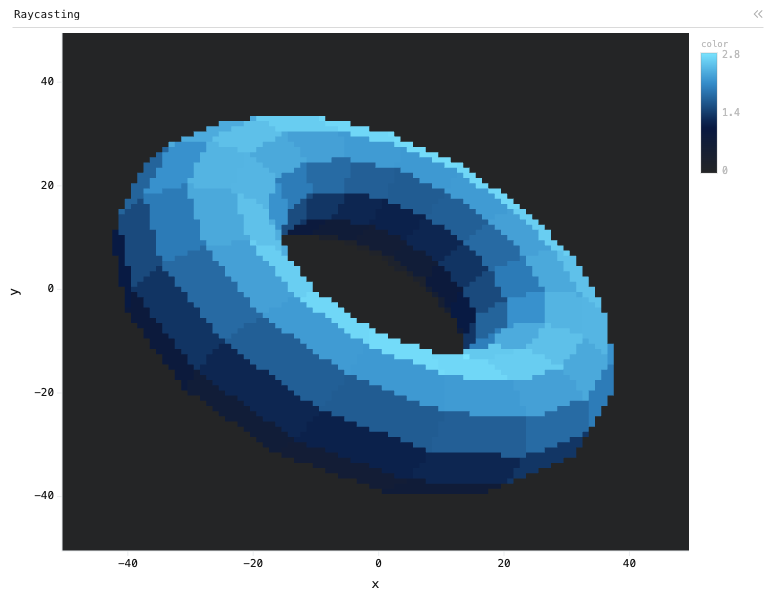
Heatmap chart of color, grouped by x, split by y, with 3 computed expression columns.
A raytraced torus, rendered by an ExprTK expression.
Data
A raytraced torus rendered entirely by Perspective's columnar expression language over a generated pixel grid, as a heatmap.
Generated in the browser when the example loads.
Configuration
This example is a saved <perspective-viewer> workspace. Pass this JSON to viewer.restoreWorkspace() to reproduce it over the same table:
{
    "layout": {
        "type": "tab-layout",
        "tabs": [
            "p0"
        ],
        "selected": 0
    },
    "panels": {
        "p0": {
            "table": "",
            "title": "Raycasting",
            "theme": null,
            "columns_config": {
                "color": {
                    "gradient": "linear-gradient(to right, #242526 50%, #071841 69.5%, #3289c8 87%, #7ae4ff 100%)"
                }
            },
            "plugin": "Heatmap",
            "group_by": [
                "x"
            ],
            "split_by": [
                "y"
            ],
            "columns": [
                "color"
            ],
            "expressions": {
                "color": "\n// Scene constants\nvar resolution := 100;\nvar fov := 30 * (pi / 180);\nvar camera[3] := {0, 0, -600};\nvar light[3] := {0.5, 1, 0};\n\n// Torus constants\nvar radius := 1;\nvar tube := 0.4;\nvar radialSegments := 12;\nvar tubularSegments := 16;\nvar rotation := 40 * (pi / 180);\n\n// Mesh\nvar arc := pi * 2;\nvar vs[663];\nfor (var j := 0; j <= radialSegments; j += 1) {\n    for (var i := 0; i <= tubularSegments; i += 1) {\n\n        // Vertex\n        var u := (i / tubularSegments) * arc;\n        var v := (j / radialSegments) * pi * 2;\n        var i0 := j * 3 * (tubularSegments + 1) + (i * 3);\n        vs[i0] := (radius + tube * cos(v)) * cos(u) * 100;\n        vs[i0 + 1] := (radius + tube * cos(v)) * sin(u) * 100;\n        vs[i0 + 2] := tube * sin(v) * 100;\n\n        // Rotate\n        var b := vs[i0 + 1];\n        var bcos := cos(rotation);\n        var bsin := sin(rotation);\n        vs[i0 + 1] := vs[i0 + 1] * bcos - vs[i0 + 2] * bsin;\n        vs[i0 + 2] := b * bsin + vs[i0 + 2] * bcos;\n        b := vs[i0];\n        vs[i0] := vs[i0] * bcos - vs[i0 + 2] * bsin;\n        vs[i0 + 2] := b * bsin + vs[i0 + 2] * bcos;\n    }\n};\n\n// Render scene\nvar scale := resolution / (tan(fov / 2) * 400);\nvar x := (floor(index() / resolution) - resolution / 2) / scale;\nvar y := (index() % resolution - resolution / 2) / scale;\nvar d[3] := {x, y, 200};\nvar color := 0;\nvar depth := inf;\nvar light_norm := norm3(light);\nfor (var j := 1; j <= radialSegments; j += 1) {\n    for (var i := 1; i <= tubularSegments; i += 1) {\n\n        // Index\n        var aa := (tubularSegments + 1) * j + i - 1;\n        var b := (tubularSegments + 1) * (j - 1) + i - 1;\n        var c := (tubularSegments + 1) * (j - 1) + i;\n        var dd := (tubularSegments + 1) * j + i;\n        var face[6] := {aa, b, dd, b, c, dd};\n        for (var ii:= 0; ii < 2; ii += 1) {\n            var i0 := face[ii * 3];\n            var i1 := face[ii * 3 + 1];\n            var i2 := face[ii * 3 + 2];\n            var v0[3] := {vs[i0 * 3], vs[i0 * 3 + 1], vs[i0 * 3 + 2]};\n            var v1[3] := {vs[i1 * 3], vs[i1 * 3 + 1], vs[i1 * 3 + 2]};\n            var v2[3] := {vs[i2 * 3], vs[i2 * 3 + 1], vs[i2 * 3 + 2]};\n\n            // Render triangle\n            var e1[3] := v1 - v0;\n            var e2[3] := v2 - v0;\n            var h[3];\n            cross_product3(d, e2, h);\n            var a := dot_product3(e1, h);\n            if (a != 0) {\n                var f := 1 / a;\n                var s[3] := camera - v0;\n                var u := f * dot_product3(s, h);\n                if (u > 0 and u < 1) {\n                    var q[3];\n                    cross_product3(s, e1, q);\n                    var v := f * dot_product3(d, q);\n                    if (v > 0 and u + v < 1) {\n                        var t := f * dot_product3(e2, q);\n                        if (t >= 0) {\n                            var t2 := 1 - u - v;\n                            var d1[3] := v0 * t2 + v1 * u + v2 * v;\n                            var dist := norm3(d1 - camera);\n                            if (dist < depth) {\n                                depth := dist;\n\n                                // Lighting\n                                var n[3];\n                                cross_product3(v0 - v1, v2 - v1, n);\n                                color := acos(dot_product3(light, n) / (light_norm * norm3(n)))\n                            }\n                        }\n                    }\n                }\n            }\n        }\n    }\n};\n\ncolor;\n",
                "x": "floor(index() / 100) - 100 / 2",
                "y": "index() % 100 - 100 / 2"
            }
        }
    },
    "active": "p0"
}
About Perspective
Perspective is an open-source, WebAssembly-powered data grid, pivot table and charting component for large, real-time and streaming datasets — in the browser, Python, Jupyter, Node.js and Rust.
Documentation