Perspective › Examples
NYPD CCRB
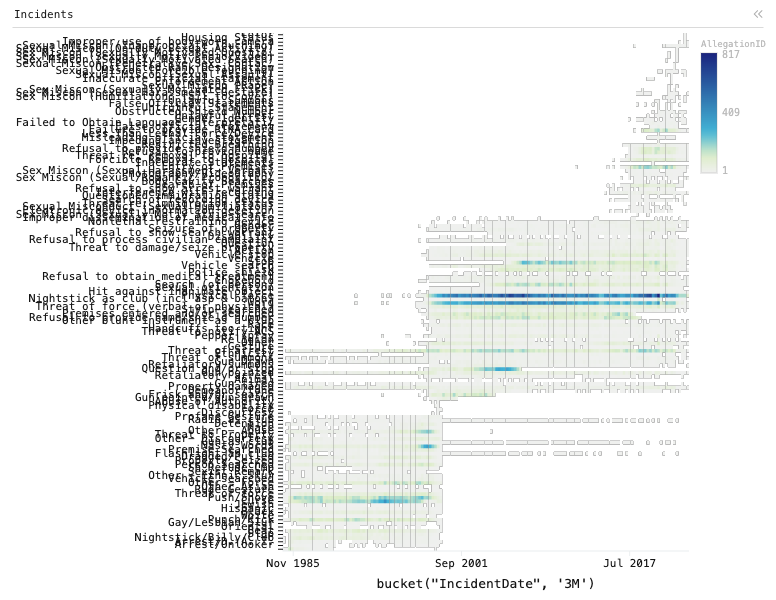
Heatmap chart of AllegationID, grouped by bucket("IncidentDate", '3M'), split by Allegation, filtered to IncidentDate > 1985-01-01, IncidentDate < 2025-01-01, sorted by IncidentDate, with 1 computed expression column.
Civilian complaints against NYPD officers.
Data
The NYCLU's database of civilian complaints against NYPD officers, loaded from Apache Arrow and cross-filtered in the browser with no server.
Loaded from /data/nypdccrb.arrow as arrow into the perspective-server engine.
Configuration
This example is a saved <perspective-viewer> workspace. Pass this JSON to viewer.restoreWorkspace() to reproduce it over the same table:
{
    "active": "PERSPECTIVE_GENERATED_ID_4",
    "layout": {
        "type": "tab-layout",
        "tabs": [
            "PERSPECTIVE_GENERATED_ID_4"
        ],
        "selected": 0
    },
    "panels": {
        "PERSPECTIVE_GENERATED_ID_4": {
            "plugin": "Heatmap",
            "table": "ccrb",
            "title": "Incidents",
            "group_by": [
                "bucket(\"IncidentDate\", '3M')"
            ],
            "split_by": [
                "Allegation"
            ],
            "sort": [
                [
                    "IncidentDate",
                    "col asc"
                ]
            ],
            "filter": [
                [
                    "IncidentDate",
                    ">",
                    "1985-01-01"
                ],
                [
                    "IncidentDate",
                    "<",
                    "2025-01-01"
                ]
            ],
            "expressions": {
                "bucket(\"IncidentDate\", '3M')": "bucket(\"IncidentDate\", '3M')"
            },
            "columns": [
                "AllegationID"
            ],
            "aggregates": {
                "IncidentDate": "median",
                "AllegationID": "distinct count"
            }
        }
    }
}
About Perspective
Perspective is an open-source, WebAssembly-powered data grid, pivot table and charting component for large, real-time and streaming datasets — in the browser, Python, Jupyter, Node.js and Rust.
Documentation