Perspective › Examples
Market — Candlestick 3 Son Of Candllestick
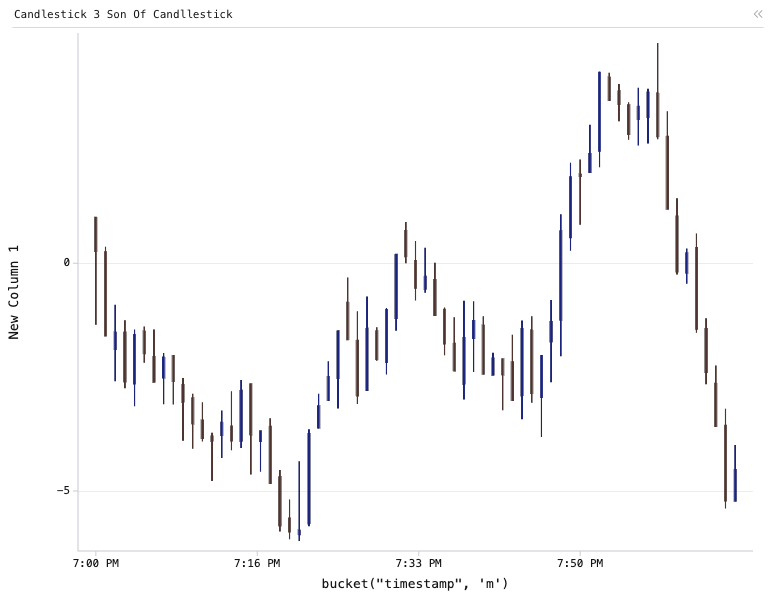
Candlestick chart of New Column 1, New Column 2, New Column 3 and New Column 4, grouped by bucket("timestamp", 'm'), filtered to status == closed, with 3 computed expression columns.
Simulated real-time order flow: a stateful matching engine on a private worker, view-mirrored to the UI.
Data
A simulated order book streaming into a Perspective table in real time: orders are created, filled, cancelled and expired continuously, and every data grid, pivot and chart updates incrementally as they arrive.
Generated continuously in the browser by a JavaScript simulation streaming into a Perspective Table.
Configuration
This example is a saved <perspective-viewer> workspace. Pass this JSON to viewer.restoreWorkspace() to reproduce it over the same table:
{
    "layout": {
        "type": "tab-layout",
        "tabs": [
            "p0"
        ],
        "selected": 0
    },
    "panels": {
        "p0": {
            "table": "market",
            "theme": null,
            "columns_config": {},
            "plugin": "Candlestick",
            "plugin_config": {},
            "title": "Candlestick 3 Son Of Candllestick",
            "group_by": [
                "bucket(\"timestamp\", 'm')"
            ],
            "split_by": [],
            "sort": [],
            "filter": [
                [
                    "status",
                    "==",
                    "closed"
                ]
            ],
            "group_rollup_mode": "flat",
            "split_rollup_mode": "flat",
            "expressions": {
                "price 3": "\"price\"",
                "price 2": "\"price\"",
                "bucket(\"timestamp\", 'm')": "bucket(\"timestamp\", 'm')"
            },
            "windows": {
                "New Column 3": {
                    "column": "price",
                    "aggregate": "avg",
                    "rows": 100
                },
                "New Column 4": {
                    "column": "price",
                    "aggregate": "avg",
                    "rows": 100
                },
                "New Column 1": {
                    "column": "price",
                    "aggregate": "avg",
                    "rows": 100
                },
                "New Column 2": {
                    "column": "price",
                    "aggregate": "avg",
                    "rows": 100
                }
            },
            "columns": [
                "New Column 1",
                "New Column 2",
                "New Column 3",
                "New Column 4",
                null
            ],
            "aggregates": {
                "New Column 3": "high",
                "New Column 2": "last",
                "New Column 4": "low",
                "New Column 1": "first"
            }
        }
    },
    "active": "p0"
}
About Perspective
Perspective is an open-source, WebAssembly-powered data grid, pivot table and charting component for large, real-time and streaming datasets — in the browser, Python, Jupyter, Node.js and Rust.
Documentation