Perspective › Examples
Mandelbrot
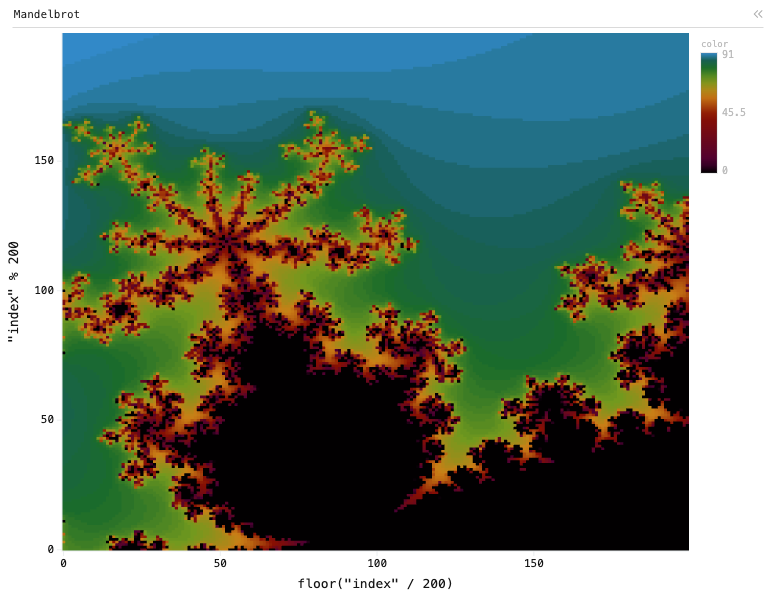
Heatmap chart of color, grouped by floor("index" / 200), split by "index" % 200, with 3 computed expression columns.
A fractal computed entirely in ExprTK, one static frame.
Data
The Mandelbrot set computed per-row by Perspective's columnar expression language over a generated coordinate grid, and rendered as a heatmap.
Generated in the browser when the example loads.
Configuration
This example is a saved <perspective-viewer> workspace. Pass this JSON to viewer.restoreWorkspace() to reproduce it over the same table:
{
    "layout": {
        "type": "tab-layout",
        "tabs": [
            "p0"
        ],
        "selected": 0
    },
    "panels": {
        "p0": {
            "table": "",
            "title": "Mandelbrot",
            "theme": null,
            "columns_config": {
                "color": {
                    "gradient": "linear-gradient(to right, #000000 50%, #4d0034 54.5%, #880f02 73.8%, #ca7f16 82.5%, #72991e 88.7%, #1a6b2a 94%, #175e59 97.5%, #3289c8 100%)"
                }
            },
            "plugin": "Heatmap",
            "group_by": [
                "floor(\"index\" / 200)"
            ],
            "split_by": [
                "\"index\" % 200"
            ],
            "columns": [
                "color"
            ],
            "expressions": {
                "color": "// color\nvar resolution := 200;\nvar xmin := -0.4;\nvar xmax := -0.3;\nvar ymin := 0.6;\nvar ymax := 0.7;\nvar iterations := 100;\n\nvar x := floor(\"index\" / resolution);\nvar y := \"index\" % resolution;\nvar c := iterations;\n\nvar cx := xmin + ((xmax - xmin) * x) / (resolution - 1);\nvar cy := ymin + ((ymax - ymin) * y) / (resolution - 1);\n\nvar vx := 0;\nvar vy := 0;\nvar vxx := 0;\nvar vyy := 0;\nvar vxy := 0;\n\nfor (var ii := 0; ii < iterations; ii += 1) {\n    if (vxx + vyy <= float(4)) {\n        vxy := vx * vy;\n        vxx := vx * vx;\n        vyy := vy * vy;\n        vx := vxx - vyy + cx;\n        vy := vxy + vxy + cy;\n        c -= 1;\n    }\n};\n\nc",
                "floor(\"index\" / 200)": "floor(\"index\" / 200)",
                "\"index\" % 200": "\"index\" % 200"
            }
        }
    },
    "active": "p0"
}
About Perspective
Perspective is an open-source, WebAssembly-powered data grid, pivot table and charting component for large, real-time and streaming datasets — in the browser, Python, Jupyter, Node.js and Rust.
Documentation