Perspective › Examples
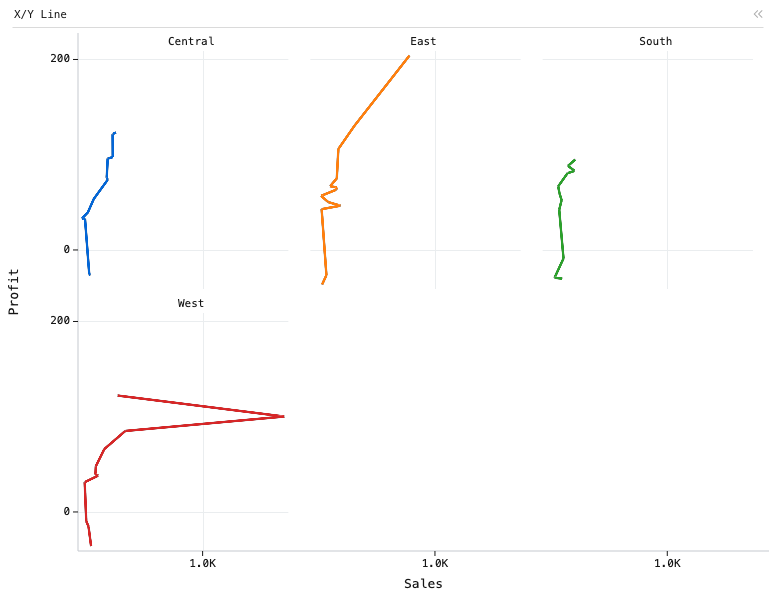
X/Y Line — Line chart with 4 lines. X is Sales. Y is Profit. Each line represents a region.
X/Y Line chart of Sales and Profit, grouped by State, split by Region, sorted by Profit and Sales.
Data
Programmatic variations on the Superstore retail sales dataset, showing the flexibility of Perspective's configuration: the same table re-queried as data grids, pivot tables and charts by changing only the viewer's JSON config.
Loaded from /data/superstore.lz4.arrow as arrow into the perspective-server engine.
Configuration
This example is a saved <perspective-viewer> workspace. Pass this JSON to viewer.restoreWorkspace() to reproduce it over the same table:
{
    "layout": {
        "type": "tab-layout",
        "tabs": [
            "p0"
        ],
        "selected": 0
    },
    "panels": {
        "p0": {
            "table": "",
            "title": "X/Y Line",
            "columns": [
                "Sales",
                "Profit"
            ],
            "plugin": "X/Y Line",
            "aggregates": {
                "Order Date": "dominant",
                "Sales": "avg",
                "Profit": "avg"
            },
            "group_by": [
                "State"
            ],
            "sort": [
                [
                    "Profit",
                    "desc"
                ],
                [
                    "Sales",
                    "desc"
                ]
            ],
            "split_by": [
                "Region"
            ],
            "theme": null
        }
    },
    "active": "p0"
}
About Perspective
Perspective is an open-source, WebAssembly-powered data grid, pivot table and charting component for large, real-time and streaming datasets — in the browser, Python, Jupyter, Node.js and Rust.
Documentation