Perspective › Examples
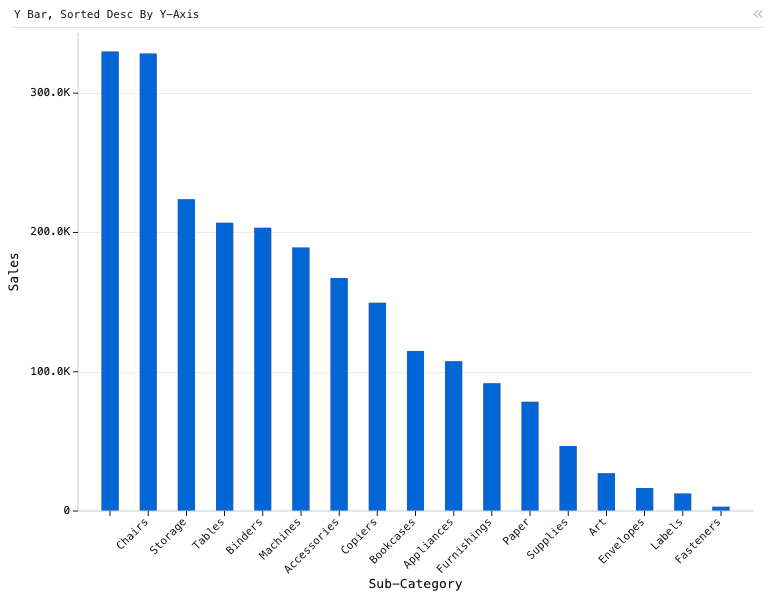
Y Bar, Sorted Desc By Y-Axis — Bar chart with 17 bars sorted descending. X is 'Sub-Category', and Y is 'Sales'.
Y Bar chart of Sales, grouped by Sub-Category, sorted by Sales.
Data
Programmatic variations on the Superstore retail sales dataset, showing the flexibility of Perspective's configuration: the same table re-queried as data grids, pivot tables and charts by changing only the viewer's JSON config.
Loaded from /data/superstore.lz4.arrow as arrow into the perspective-server engine.
Configuration
This example is a saved <perspective-viewer> workspace. Pass this JSON to viewer.restoreWorkspace() to reproduce it over the same table:
{
    "layout": {
        "type": "tab-layout",
        "tabs": [
            "p0"
        ],
        "selected": 0
    },
    "panels": {
        "p0": {
            "table": "",
            "title": "Y Bar, Sorted Desc By Y-Axis",
            "plugin": "Y Bar",
            "group_by": [
                "Sub-Category"
            ],
            "columns": [
                "Sales"
            ],
            "sort": [
                [
                    "Sales",
                    "desc"
                ]
            ],
            "theme": null
        }
    },
    "active": "p0"
}
About Perspective
Perspective is an open-source, WebAssembly-powered data grid, pivot table and charting component for large, real-time and streaming datasets — in the browser, Python, Jupyter, Node.js and Rust.
Documentation