Perspective › Examples
Benchmarks — JavaScript
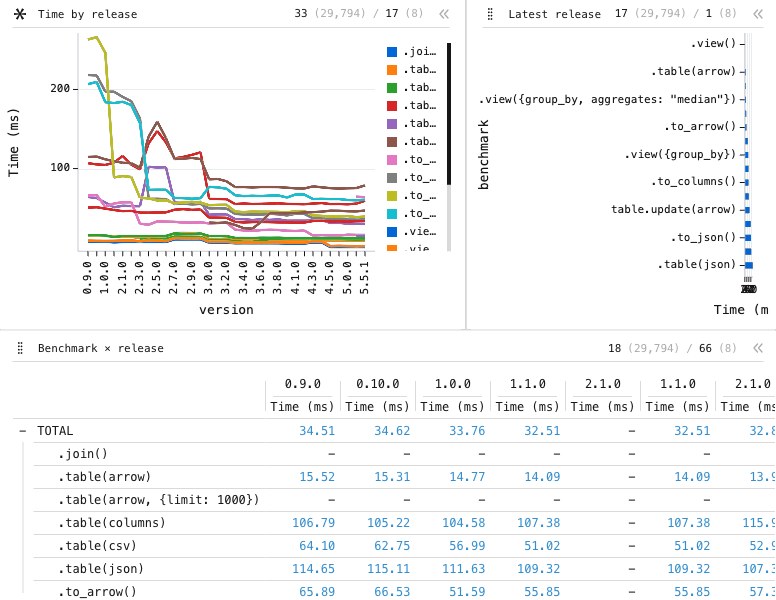
3-panel dashboard of Y Line, X Bar and Datagrid: Y Line chart of Time (ms), grouped by version, split by benchmark, filtered to outlier == false, sorted by version_idx, with 1 computed expression column; X Bar chart of Time (ms), grouped by benchmark, filtered to outlier == false, version_idx == 0, sorted by Time (ms), with 1 computed expression column; Data grid of Time (ms), grouped by benchmark, split by version, filtered to outlier == false, sorted by version_idx, with 1 computed expression column.
Perspective's JavaScript benchmark results for every release: time by release, the latest release by case, and the full benchmark × release matrix.
Data
Perspective's own benchmark results for the JavaScript build — the WebAssembly engine under Node.js — as published with each GitHub release: every timed iteration of table construction, streaming updates, pivots, expressions, joins and serialization over the Superstore dataset, for the current and every prior release, measured by CI on a GitHub Actions ubuntu-22.04 runner.
Loaded from /data/benchmark-js.arrow as arrow into the perspective-server engine.
Configuration
This example is a saved <perspective-viewer> workspace. Pass this JSON to viewer.restoreWorkspace() to reproduce it over the same table:
{
    "layout": {
        "type": "split-layout",
        "orientation": "vertical",
        "sizes": [
            0.55,
            0.45
        ],
        "children": [
            {
                "type": "split-layout",
                "orientation": "horizontal",
                "sizes": [
                    0.6,
                    0.4
                ],
                "children": [
                    {
                        "type": "tab-layout",
                        "tabs": [
                            "history"
                        ],
                        "selected": 0
                    },
                    {
                        "type": "tab-layout",
                        "tabs": [
                            "latest"
                        ],
                        "selected": 0
                    }
                ]
            },
            {
                "type": "tab-layout",
                "tabs": [
                    "matrix"
                ],
                "selected": 0
            }
        ]
    },
    "panels": {
        "history": {
            "table": "",
            "title": "Time by release",
            "plugin": "Y Line",
            "group_by": [
                "version"
            ],
            "split_by": [
                "benchmark"
            ],
            "columns": [
                "Time (ms)"
            ],
            "expressions": {
                "Time (ms)": "\"real_time\" / 1000"
            },
            "aggregates": {
                "Time (ms)": "avg",
                "version_idx": "avg"
            },
            "filter": [
                [
                    "outlier",
                    "==",
                    false
                ]
            ],
            "sort": [
                [
                    "version_idx",
                    "desc"
                ]
            ]
        },
        "latest": {
            "table": "",
            "title": "Latest release",
            "plugin": "X Bar",
            "group_by": [
                "benchmark"
            ],
            "columns": [
                "Time (ms)"
            ],
            "expressions": {
                "Time (ms)": "\"real_time\" / 1000"
            },
            "aggregates": {
                "Time (ms)": "avg"
            },
            "filter": [
                [
                    "outlier",
                    "==",
                    false
                ],
                [
                    "version_idx",
                    "==",
                    0
                ]
            ],
            "sort": [
                [
                    "Time (ms)",
                    "asc"
                ]
            ]
        },
        "matrix": {
            "table": "",
            "title": "Benchmark × release",
            "plugin": "Datagrid",
            "group_by": [
                "benchmark"
            ],
            "split_by": [
                "version"
            ],
            "columns": [
                "Time (ms)"
            ],
            "expressions": {
                "Time (ms)": "\"real_time\" / 1000"
            },
            "aggregates": {
                "Time (ms)": "avg",
                "version_idx": "avg"
            },
            "filter": [
                [
                    "outlier",
                    "==",
                    false
                ]
            ],
            "sort": [
                [
                    "version_idx",
                    "col desc"
                ]
            ]
        }
    },
    "active": "history"
}
About Perspective
Perspective is an open-source, WebAssembly-powered data grid, pivot table and charting component for large, real-time and streaming datasets — in the browser, Python, Jupyter, Node.js and Rust.
Documentation